

Quite a topical issue at the moment.
But how do we estimate salmon population trends from smolt outputs and salmon returnees. Here's a rough guide from the statistical side of the fence (") as ever, not the fisheries science side). Actual fisheries scientists are welcome to chip in to correct anything
as ever, not the fisheries science side). Actual fisheries scientists are welcome to chip in to correct anything
First you need to guess how many smolts go out from "Your River". This can be various methods from voodoo economics guesswork, electrofishing, to fixed trapping (restricted burn or lade) or rotary screw trap.
Lets say we use mark-recapture rotary trapping. So you catch some smolts then mark them so you will spot them if and when count them again. Release them upstream (when and how far up etc. introduces new variables that will probably affect the outcome) . Then the proportion of marked fish recaptured in the next batch gives an assessment used to estimate the actual numbers passing. Assuming that you correct for handling etc. mortality (which can also vary a lot depending on conditions) and assume (in the case of fixed traps) that the number not counted is proportionately similar always (which it's not).
Most appear to assume the factors that caused them to be caught is constant and invariate. What if the river comes up? What if the river goes down, do smolt migration routes change day to day. What about the propensity for human error? How do electrofishing results vary week on week for example if you were to re-run the experiments?
If you do the same assessment a few days later do you get the same result? Is this a field duplicate or a replicate or what? Does it pass stats tests?
Do you then average all the results? If so how do we avoid year on year apples and oranges if using different size databases?
All the while, and at just about every stage, apply no form or proper QA-QC (quality assurance-quality control) to the assessment procedure and methodology.
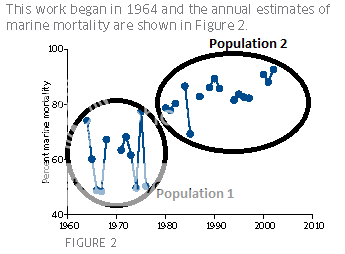
As a final comment about smolt outputs, be cautious about the marine mortality data from the River N Esk, comparing the pre-1981 data with the post 1981 data. This is because of "apples and oranges" stats. The pre-1981 data used a different methodology to the post 1981 data and hence the massive decline jumped on by the SCS may be reflect the change in methodologies. This graph, which is often used by folk to demonstrate a decline, in reality IMHO it just shows two different populations and IGNORES more recent data (post-2002 to 2009, because that reversed the trend)
More GIGO, perhaps.
Righto that's the easy bit.
You now proudly own some data points telling you how many smolts you estimate to have produced from the whole river on the basis of incredibly limited sampling and lots of thumb sucks and dodgy estimation / extrapolation.
Is it garbage? Is it worth using? Should it come with a Public Health Warning? Is the annual variance shocking? What about the standard deviation? How confident are you that it actually represents anything at all?
How do your errors change over time?
Next? Well now you "know" how many smolts you produced in one year, that's the starting point.
So then you have to guess how many will be females, how many will return as grilse the next year, or as MSW fish the following year (and presumably you will be able to differentiate them from that years grilse returners)
In the old days you just guessed the numbers caught in the nets nearby, GUESSTIMATED how many of those were bound for Your River, and GUESSTIMATED an exploitation rate to back-calculate the number of returners.
Then all you need to do is calculate the number of returners and compare it to the number of smolts you sent out. This gives you the marine survival rate.
Simples, right?
Err, funnily enough it's not.
Next say you just check the number of returners to Your River, with a counter (if you're lucky, and subject to all the massive caveats of counter data such as whatever happens downstream of the counter - i.e. could be Garbage too). Failing that you guess by taking the rod catch and guessing an exploitation rate, and guess an undeclared catch rate to finally guess how many salmon came back.
Then you take the guess of smolts out and compare with the guess of salmon in, and work out the guess of marine mortality on the basis of those two main guesses and a whole load more minor guesses.
Simples, still, yes
Bear in mind that you really do need to ignore any effect of straying (which may vary year-to-year), undeclared catch (ditto) change in exploitation rate (ditto) change in fishing effort (ditto) before you do these super-accurate guesstimates.
Of the two, straying may be the most important.
For both the N Esk and Girnock burn experiments of MSS, tagged smolts were recorded when they were caught as returning adults.
Most importantly, a bare minimum 30+% of all these had strayed from their natal river. They were recorded from Tay to Solway! That's just those that were actually recorded (others may have been eaten surreptitiously). Any outwith Scotland were less likely to be recorded at all. Now if this amount varies year on year, or decade to decade, anyone with any sense can see the actual marine mortality GUESSTIMATE is fundamentally and mortally flawed. The original document this is contained in is quoted here http://www.salmonfishingforum.com/forums/thread19531-5.html post#41.
As a final comment, please be aware of those in the SCS quoting the marine mortality data from the River Bush as though it is science fact. They seem to like using it because it is the most dramatic to support their case (i.e. an apparent huge decline in returners, at odds to actual real data)
The "Bush Guesstimate" appears to be based on a fixed constant assumption of 30% exploitation rate (ER) and other assumptions (according to ICES WGNAS 2014 report at least ) regardless of what the actual ER was.
Other means of assessing estimates of marine mortality may be similarly questionable.
It's called wagging the dog.
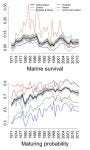
However, there are other estimates available for what happens at sea. This is all the local data for our nearby countries producing an estimated post-smolt mortality rate:
![]()
(figure 2.3.9.2 of ICES WGNAS 2014 Report)
Interested observers will note that the global average fluctuates from 1970 to present around the average, being 5-15%. The Irish example most quoted by certain sectors is in red and is highly anomalous compared to the rest. One wonders why?
Time for another sea-change, perhaps?
But how do we estimate salmon population trends from smolt outputs and salmon returnees. Here's a rough guide from the statistical side of the fence (
as ever, not the fisheries science side). Actual fisheries scientists are welcome to chip in to correct anything First you need to guess how many smolts go out from "Your River". This can be various methods from voodoo economics guesswork, electrofishing, to fixed trapping (restricted burn or lade) or rotary screw trap.
Lets say we use mark-recapture rotary trapping. So you catch some smolts then mark them so you will spot them if and when count them again. Release them upstream (when and how far up etc. introduces new variables that will probably affect the outcome) . Then the proportion of marked fish recaptured in the next batch gives an assessment used to estimate the actual numbers passing. Assuming that you correct for handling etc. mortality (which can also vary a lot depending on conditions) and assume (in the case of fixed traps) that the number not counted is proportionately similar always (which it's not).
Most appear to assume the factors that caused them to be caught is constant and invariate. What if the river comes up? What if the river goes down, do smolt migration routes change day to day. What about the propensity for human error? How do electrofishing results vary week on week for example if you were to re-run the experiments?
If you do the same assessment a few days later do you get the same result? Is this a field duplicate or a replicate or what? Does it pass stats tests?
Do you then average all the results? If so how do we avoid year on year apples and oranges if using different size databases?
All the while, and at just about every stage, apply no form or proper QA-QC (quality assurance-quality control) to the assessment procedure and methodology.
As a final comment about smolt outputs, be cautious about the marine mortality data from the River N Esk, comparing the pre-1981 data with the post 1981 data. This is because of "apples and oranges" stats. The pre-1981 data used a different methodology to the post 1981 data and hence the massive decline jumped on by the SCS may be reflect the change in methodologies. This graph, which is often used by folk to demonstrate a decline, in reality IMHO it just shows two different populations and IGNORES more recent data (post-2002 to 2009, because that reversed the trend)

More GIGO, perhaps.
Righto that's the easy bit.
You now proudly own some data points telling you how many smolts you estimate to have produced from the whole river on the basis of incredibly limited sampling and lots of thumb sucks and dodgy estimation / extrapolation.
Is it garbage? Is it worth using? Should it come with a Public Health Warning? Is the annual variance shocking? What about the standard deviation? How confident are you that it actually represents anything at all?
How do your errors change over time?
Next? Well now you "know" how many smolts you produced in one year, that's the starting point.
So then you have to guess how many will be females, how many will return as grilse the next year, or as MSW fish the following year (and presumably you will be able to differentiate them from that years grilse returners
)In the old days you just guessed the numbers caught in the nets nearby, GUESSTIMATED how many of those were bound for Your River, and GUESSTIMATED an exploitation rate to back-calculate the number of returners.
Then all you need to do is calculate the number of returners and compare it to the number of smolts you sent out. This gives you the marine survival rate.
Simples, right?
Err, funnily enough it's not.
Next say you just check the number of returners to Your River, with a counter (if you're lucky, and subject to all the massive caveats of counter data such as whatever happens downstream of the counter - i.e. could be Garbage too). Failing that you guess by taking the rod catch and guessing an exploitation rate, and guess an undeclared catch rate to finally guess how many salmon came back.
Then you take the guess of smolts out and compare with the guess of salmon in, and work out the guess of marine mortality on the basis of those two main guesses and a whole load more minor guesses.
Simples, still, yes
Bear in mind that you really do need to ignore any effect of straying (which may vary year-to-year), undeclared catch (ditto) change in exploitation rate (ditto) change in fishing effort (ditto) before you do these super-accurate guesstimates.
Of the two, straying may be the most important.
For both the N Esk and Girnock burn experiments of MSS, tagged smolts were recorded when they were caught as returning adults.
Most importantly, a bare minimum 30+% of all these had strayed from their natal river. They were recorded from Tay to Solway! That's just those that were actually recorded (others may have been eaten surreptitiously). Any outwith Scotland were less likely to be recorded at all. Now if this amount varies year on year, or decade to decade, anyone with any sense can see the actual marine mortality GUESSTIMATE is fundamentally and mortally flawed. The original document this is contained in is quoted here http://www.salmonfishingforum.com/forums/thread19531-5.html post#41.
As a final comment, please be aware of those in the SCS quoting the marine mortality data from the River Bush as though it is science fact. They seem to like using it because it is the most dramatic to support their case (i.e. an apparent huge decline in returners, at odds to actual real data)
The "Bush Guesstimate" appears to be based on a fixed constant assumption of 30% exploitation rate (ER) and other assumptions (according to ICES WGNAS 2014 report at least
) regardless of what the actual ER was.Other means of assessing estimates of marine mortality may be similarly questionable.
It's called wagging the dog.
However, there are other estimates available for what happens at sea. This is all the local data for our nearby countries producing an estimated post-smolt mortality rate:
(figure 2.3.9.2 of ICES WGNAS 2014 Report)
Interested observers will note that the global average fluctuates from 1970 to present around the average, being 5-15%. The Irish example most quoted by certain sectors is in red and is highly anomalous compared to the rest. One wonders why?
Time for another sea-change, perhaps?